- Login to Google Analytics using webmanager@nma.gov.au
- Select campaign date range for the report
Page views
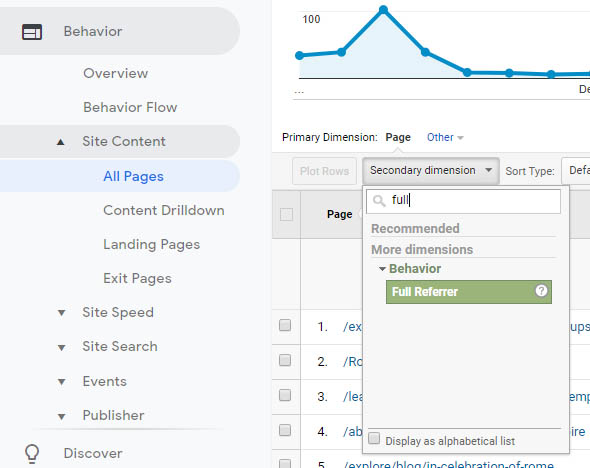
- From the left navigation pane, select Behaviour, Site Content, All Pages
- In the filter field, enter keyword that corresponds to main url for the campaign content (eg: rome to include all urls with rome in it)
- Produce report for top pages, detailing page views, average time on page and any other information requested by business, using the following format:
Page | Page views | % of traffic for Midawarr content | Avg. Time on Page |
midawarr-harvest | 7,160 | 77% | 0:04:35 |
midawarr-harvest/events | 730 | 8% | 0:03:04 |
midawarr-harvest/book | 396 | 4% | 0:05:07 |
midawarr-harvest/artists | 231 | 2% | 0:01:57 |
media_releases/midawarr-harvest | 208 | 2% | 0:04:10 |
All other Midawarr pages | 631 | 7% | n/a |
Total | 9,356 | * 1% | 0:04:14 |
* percentage of all website traffic
Referrals
- From the report above, select (browse to) the main campaign page
- Add a Secondary dimension called Full Referrer
- Report on top referrals to the campaign page.
Campaign URLs
If promotional urls were utilised for the campaign/exhibition, then the data around that promotion can be easily (and neatly) accessed via Google Analytics, as follows:
- Select the date range for the report
- From the left navigation pane, select Acquisition, Campaign, All Campaigns
- Browse to and select the corresponding campaign
- Report on the top results.

Sample report: D18/4651 Songlines web wrap-up report (CM9 reference)
Additional information
Add any other additional information the business requires.
Audio tours: The Loop
App usage overview
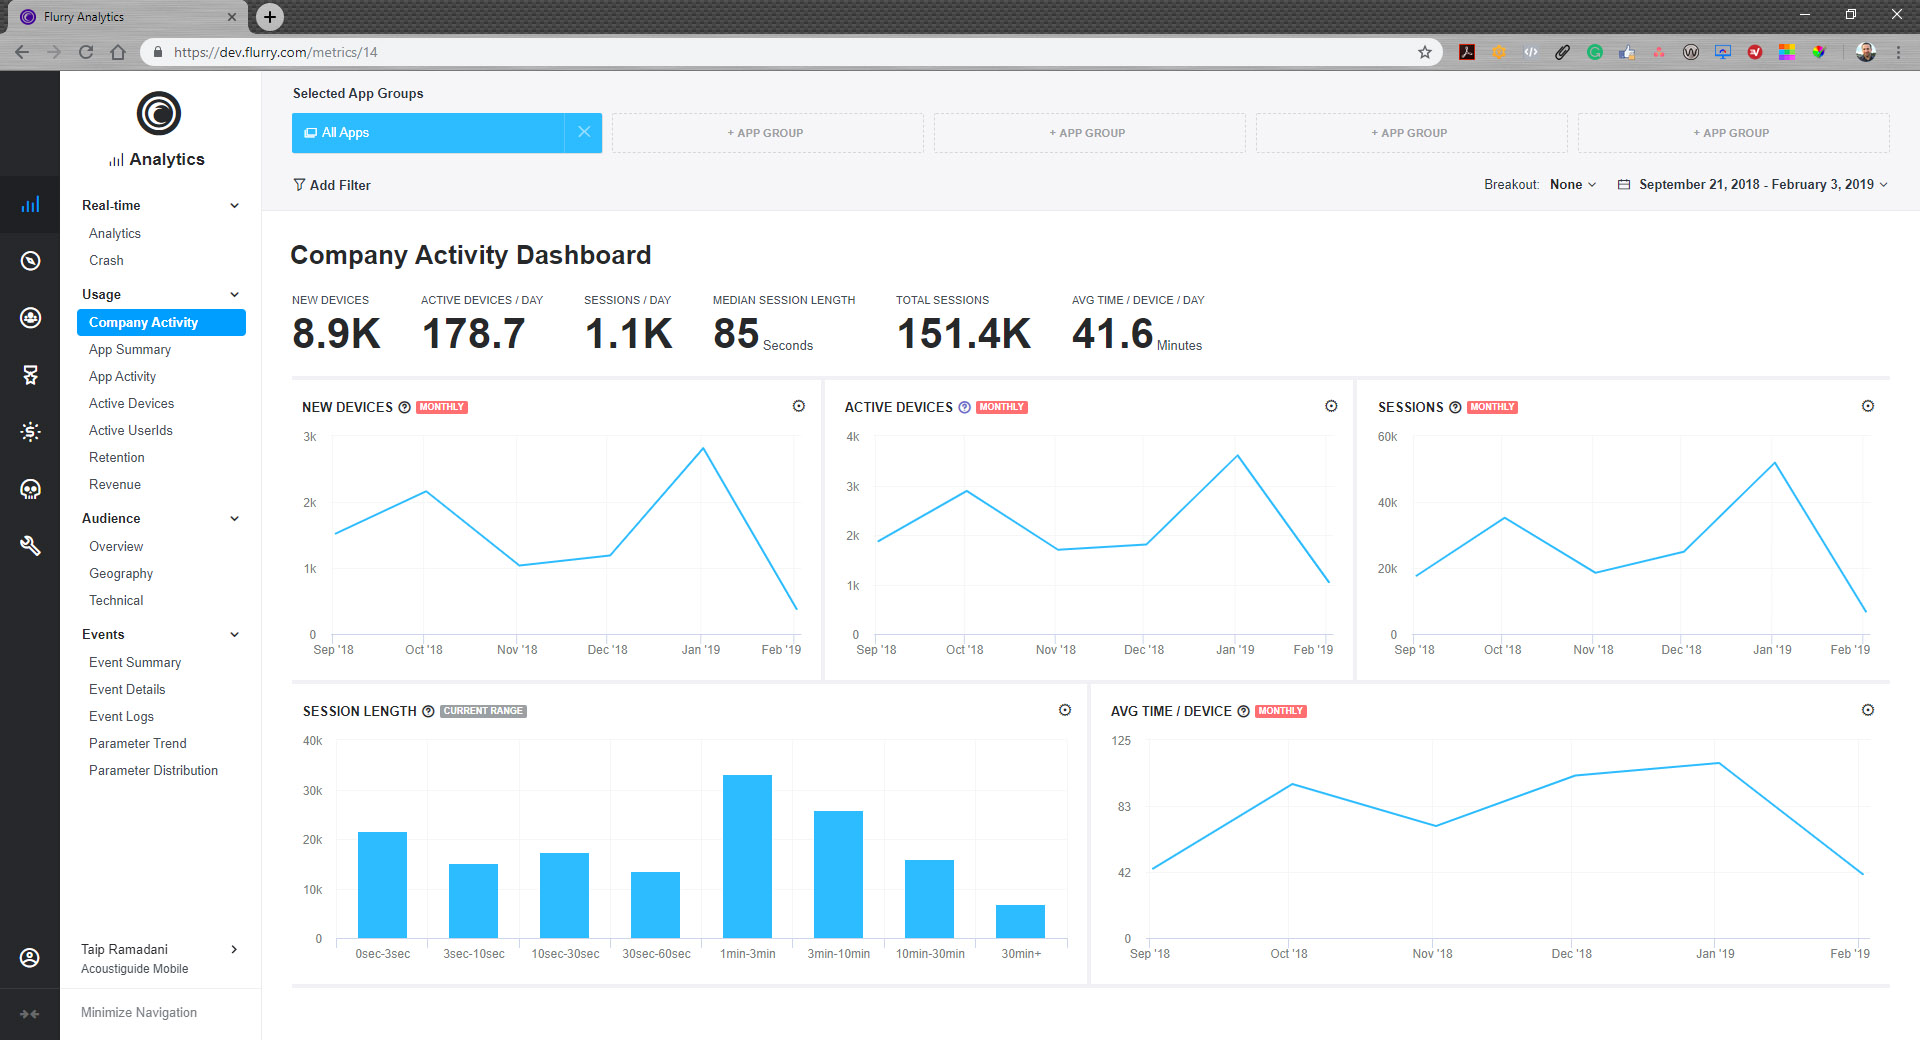
App overview data is available from Flurry analytics.
Set the exhibition dates and run the report.
Note that this overview includes all devices, for android and apple, and all tours (including sessions where no tour was opened). This is a measure of all app activity during the selected time.
Usage by tour
To break-down usage, sessions and session length by tour, use Flurry explorer
For more information on how to extract data refer to How to compile app usage reports.